(Click the image to enlarge it)

|
|
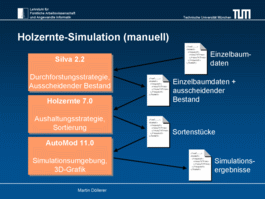
Figure 1: Manual Simulation of Forest Harvesting Operations
(Hemm 2006) (Click the image to enlarge it) |
To demonstrate that the reference implementation of the KOMET Architecture works properly, a demonstrator was implemented. It provides the same functionality as the system to simulate forest harvest operations, which was realised by Dr. Martin Hemm during his PhD project (Hemm 2006, see Fig. 1).
The simulation system consists of three applications:

|
|
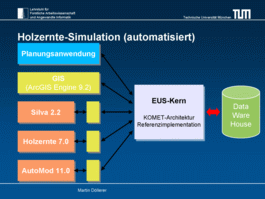
Figure 2: Automated Simulation of Forest Harvesting
Operations with KOMET (Click the image to enlarge it) |
The demonstrator integrates SILVA, Holzernte and Automod into one single Spatial Decision Support System (SDSS) with help of the reference implementation of the KOMET Architecture. Small programs, called wrappers, translate between these lecagy applications and the DSS kernel (shown as small yellow boxes in Fig. 2). The solvers SILVA, HOLZERNTE and AMOD were implemented this way. The spatial data about stands and trees are maintained with help of the solver GIS. It was developed from scratch and conforms to the KOMET Architecture (shown in yellow in Fig. 2). The SDSS os designed to support the comparison of different treatment alternatives. These scenario definitions are made available with help of another solver named REUS.
A planning application, which also conforms to the KOMET Architecture (shown in blue in Fig. 2), enables the user to control the simulation. With its help all configuration options of all solvers can be changed with one single user interface. The solvers get activated in the right order, their results are stored in a centralised data base and the final results are displayed as a table - containing one column per treatment alternative - so that the decision maker can compare them visually. The planning application looks very similar to the Windows Explorer and the simulation is performed in six steps. Like a Windows Wizard, the user can navigate back and forth by using the buttons "Continue" and "Back".

|
|
Figure 3: Solver Selection (Click the image to enlarge it) |
1st Step: Solver selektion
If the results of a solver are already available in the data base, e. g.
because its input parameters have not changed, its activation will not
be necessary. Thus, the activation status of every solver is configurable,
in order to speed up the overall simulation process (see Fig. 3).

|
|
Figure 4: Scenario Selection (Click the image to enlarge it) |
2nd Step: Scenario selection
A scenario is the combination of a forest stand and a treatment
alternative. One scenario out of a list of all available scenarios can
be activated (see Fig. 4).

|
|
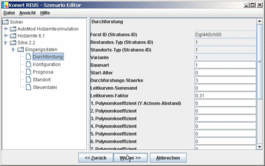
Figure 5: Scenario Editor used for Solver Configuration (Click the image to enlarge it) |
3rd Step: Solver configuration
The solvers can be configured differently according to a certain scenario.
This is used to model different treatment alternatives. The solvers are
configured with help of the scenario editor (see Fig. 5).

|
|
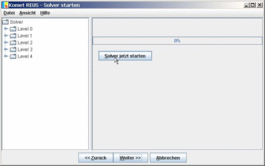
Figure 6: Solver Activation (Click the image to enlarge it) |
4th Step: Solver activation
After their configuration, the solvers are activated by the planning
application in the right order. That is, the activation order ensures that
all information needed by a certain solver is available in the data
base (see Fig. 6).

|
|
Figure 7: Result Selection (Click the image to enlarge it) |
5th Step: Result selection
All final results are available for selection after the solvers finished
their calculations. The decision maker can select the results of interest,
which are to be visualised in the final table for comparison (see Fig. 7).

|
|
Figure 8: Result Visualisation (Click the image to enlarge it) |
6th Step: Result visualisation
The results selected in step 5 are shown as a table. One column for each
treatment alternative will be generated (see Fig. 8).

Martin Döllerer
- zuletzt geändert am 01.01.1970 um 00:00 Uhr